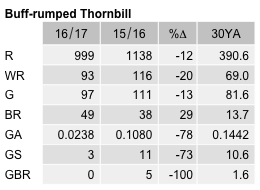
Buff-rumped Thornbill
Acanthiza reguloides
ABR description
The following is extracted from the Annual Bird Report for the twelve months to June 2017.
Common, breeding resident
Forages in the middle levels of foliage in drier grassy woodlands.
General: Number of birds (5562) down by 18% on last year but numbers much higher than 10 (3061) and 30YAs (1759). Reporting rate 7.2% is 26% down on last year, and well under the 10 and 30YA and is still declining since 1999 towards its lowest value ever. Mean 5.7, median 4, max 42/9 Apr Michelago Grl24 (HeS1). 48 breeding records from 20 grids. First breeding nb/16 Jul The Pinnacle NR (AlB1) and last dy/17 Apr The Pinnacle NR (AlB1).
GBS: A massive reduction in records from 86 last year to only 19 this year from only 2 rural and 1 suburban site (5%), and only 19 weeks. There were only 2 sightings in Canberra suburbs. The plummeting abundance value, and reporting rate make for a very pessimistic outlook for this species in Canberra gardens. Abundance (A=0.0238) is 78% lower than last year and down 88% on the 10YA. Average 3.2, median 2, with max 6/2wk Feb Giralang (McD4). No breeding records.
Abundance
Abundance is the average number of birds of that species per survey. Where the species was observed (presence recorded) but the number of birds seen was not recorded, this is treated as a count of zero.
Abundance by year
This chart shows the abundance of Buff-rumped Thornbill between 1982 and 2017. 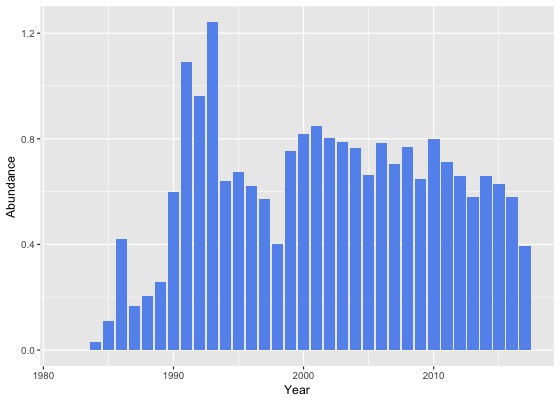
Abundance by month
This chart shows the monthly abundance of Buff-rumped Thornbill. The blue lines show the abundance for the twelve months to June 2017 and the bars show the average abundance for the period 1982 to 2017. 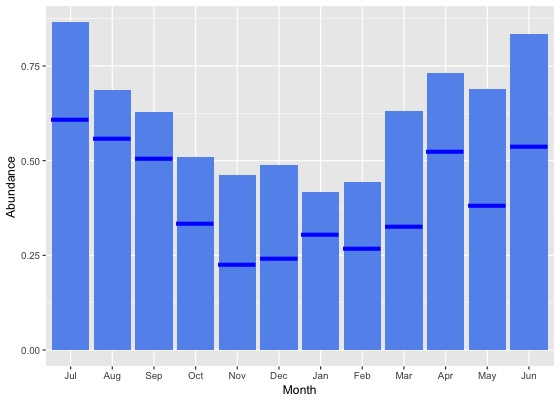
Abundance by season
This chart shows the seasonal abundance of Buff-rumped Thornbill. The blue lines show the seasonal abundance for the twelve months to June 2017 and the bars show the average seasonal abundance for the period 1982 to 2017. 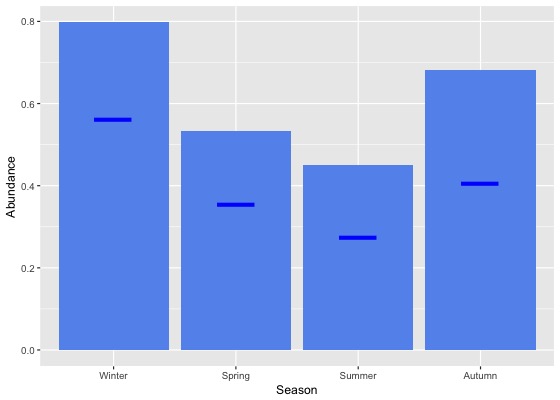
Abundance data
| Month | Season | ||||||||||||||||||
|---|---|---|---|---|---|---|---|---|---|---|---|---|---|---|---|---|---|---|---|
| Period | Jul | Aug | Sep | Oct | Nov | Dec | Jan | Feb | Mar | Apr | May | Jun | Winter | Spring | Summer | Autumn | All | ||
| All years | |||||||||||||||||||
| All | 0.9 | 0.7 | 0.6 | 0.5 | 0.5 | 0.5 | 0.4 | 0.4 | 0.6 | 0.7 | 0.7 | 0.8 | 0.8 | 0.5 | 0.5 | 0.7 | 0.6 | ||
| Previous years | |||||||||||||||||||
| All previous years | 0.9 | 0.7 | 0.6 | 0.5 | 0.5 | 0.5 | 0.4 | 0.5 | 0.7 | 0.8 | 0.8 | 0.9 | 0.8 | 0.6 | 0.5 | 0.7 | 0.6 | ||
| Previous 30 years | 0.9 | 0.7 | 0.7 | 0.5 | 0.5 | 0.5 | 0.4 | 0.5 | 0.7 | 0.8 | 0.8 | 0.9 | 0.9 | 0.6 | 0.5 | 0.7 | 0.6 | ||
| Previous 20 years | 1.0 | 0.8 | 0.7 | 0.6 | 0.5 | 0.5 | 0.5 | 0.5 | 0.7 | 0.8 | 0.8 | 1.0 | 0.9 | 0.6 | 0.5 | 0.7 | 0.7 | ||
| 10 year groups | |||||||||||||||||||
| [2007,2017) | 1.1 | 0.8 | 0.7 | 0.6 | 0.5 | 0.6 | 0.4 | 0.5 | 0.7 | 0.7 | 0.7 | 0.9 | 0.9 | 0.6 | 0.5 | 0.7 | 0.6 | ||
| [1997,2007) | 1.0 | 0.8 | 0.8 | 0.5 | 0.7 | 0.5 | 0.6 | 0.7 | 0.8 | 0.8 | 1.0 | 1.1 | 1.0 | 0.7 | 0.6 | 0.9 | 0.8 | ||
| [1987,1997) | 0.5 | 0.5 | 0.4 | 0.4 | 0.4 | 0.5 | 0.3 | 0.3 | 0.6 | 0.9 | 0.7 | 0.6 | 0.5 | 0.4 | 0.4 | 0.7 | 0.5 | ||
| 5 year groups | |||||||||||||||||||
| [2012,2017) | 1.0 | 0.8 | 0.6 | 0.6 | 0.4 | 0.6 | 0.4 | 0.4 | 0.6 | 0.7 | 0.7 | 0.9 | 0.9 | 0.5 | 0.5 | 0.7 | 0.6 | ||
| [2007,2012) | 1.1 | 0.8 | 0.7 | 0.6 | 0.6 | 0.6 | 0.5 | 0.6 | 0.8 | 0.8 | 0.8 | 1.0 | 1.0 | 0.7 | 0.5 | 0.8 | 0.7 | ||
| [2002,2007) | 1.0 | 0.9 | 0.8 | 0.5 | 0.8 | 0.5 | 0.4 | 0.5 | 0.8 | 0.9 | 1.0 | 1.2 | 1.0 | 0.7 | 0.5 | 0.9 | 0.8 | ||
| [1997,2002) | 1.0 | 0.8 | 0.7 | 0.5 | 0.6 | 0.6 | 0.7 | 0.8 | 0.8 | 0.8 | 1.1 | 0.9 | 0.9 | 0.6 | 0.7 | 0.8 | 0.7 | ||
| [1992,1997) | 0.7 | 0.9 | 0.8 | 0.6 | 0.7 | 1.0 | 0.4 | 0.4 | 0.6 | 1.3 | 1.0 | 1.1 | 0.9 | 0.7 | 0.6 | 1.0 | 0.8 | ||
| [1987,1992) | 0.3 | 0.3 | 0.3 | 0.2 | 0.2 | 0.2 | 0.3 | 0.2 | 0.5 | 0.6 | 0.5 | 0.4 | 0.4 | 0.3 | 0.3 | 0.5 | 0.3 | ||
| Year | |||||||||||||||||||
| 2017 | 0.6 | 0.6 | 0.5 | 0.3 | 0.2 | 0.2 | 0.3 | 0.3 | 0.3 | 0.5 | 0.4 | 0.5 | 0.6 | 0.4 | 0.3 | 0.4 | 0.4 | ||
| 2016 | 1.1 | 0.6 | 0.6 | 0.5 | 0.6 | 0.7 | 0.4 | 0.4 | 0.6 | 0.7 | 0.5 | 0.6 | 0.8 | 0.5 | 0.5 | 0.6 | 0.6 | ||
| 2015 | 1.1 | 0.9 | 0.6 | 0.7 | 0.3 | 0.5 | 0.5 | 0.5 | 0.5 | 0.6 | 0.8 | 0.8 | 0.9 | 0.6 | 0.5 | 0.6 | 0.6 | ||
| 2014 | 1.0 | 0.9 | 0.7 | 0.6 | 0.4 | 0.6 | 0.4 | 0.6 | 0.8 | 0.8 | 0.9 | 0.9 | 0.9 | 0.6 | 0.5 | 0.8 | 0.7 | ||
| 2013 | 0.9 | 0.9 | 0.7 | 0.7 | 0.3 | 0.3 | 0.4 | 0.5 | 0.6 | 0.7 | 0.6 | 0.9 | 0.9 | 0.6 | 0.4 | 0.6 | 0.6 | ||
| 2012 | 0.8 | 0.9 | 0.6 | 0.5 | 0.4 | 0.6 | 0.4 | 0.6 | 0.9 | 0.8 | 0.7 | 1.2 | 1.0 | 0.5 | 0.5 | 0.8 | 0.7 | ||
| 2011 | 1.1 | 0.7 | 0.8 | 0.9 | 0.4 | 0.4 | 0.7 | 0.6 | 0.8 | 0.9 | 0.5 | 0.7 | 0.8 | 0.8 | 0.5 | 0.7 | 0.7 | ||
| 2010 | 1.7 | 0.9 | 0.8 | 0.8 | 0.6 | 0.6 | 0.3 | 0.8 | 0.8 | 0.7 | 1.0 | 1.2 | 1.2 | 0.8 | 0.5 | 0.8 | 0.8 | ||
| 2009 | 0.7 | 0.3 | 0.5 | 0.5 | 0.6 | 0.6 | 0.3 | 0.4 | 0.8 | 0.9 | 0.8 | 1.3 | 0.9 | 0.5 | 0.4 | 0.8 | 0.6 | ||
| 2008 | 1.6 | 0.9 | 1.0 | 0.5 | 0.8 | 0.5 | 0.6 | 0.6 | 0.9 | 0.7 | 1.2 | 0.7 | 1.0 | 0.7 | 0.5 | 0.9 | 0.8 | ||
| 2007 | 0.7 | 0.8 | 0.6 | 0.5 | 0.6 | 0.8 | 0.4 | 0.7 | 0.6 | 0.7 | 1.2 | 1.1 | 1.0 | 0.6 | 0.6 | 0.8 | 0.7 | ||
| 2006 | 1.8 | 0.9 | 0.6 | 0.7 | 0.7 | 0.5 | 0.3 | 0.6 | 0.6 | 1.0 | 0.8 | 1.1 | 1.3 | 0.7 | 0.5 | 0.8 | 0.8 | ||
| 2005 | 0.6 | 0.8 | 0.7 | 0.2 | 0.4 | 0.5 | 0.5 | 0.8 | 0.6 | 0.6 | 0.9 | 1.1 | 0.9 | 0.5 | 0.6 | 0.7 | 0.7 | ||
| 2004 | 0.5 | 0.9 | 0.6 | 0.3 | 1.5 | 0.4 | 0.4 | 0.5 | 0.8 | 1.2 | 0.8 | 1.5 | 0.9 | 0.8 | 0.4 | 0.9 | 0.8 | ||
| 2003 | 1.6 | 1.0 | 1.0 | 0.4 | 0.5 | 0.6 | 0.5 | 0.3 | 1.1 | 0.9 | 1.4 | 0.8 | 1.1 | 0.6 | 0.5 | 1.1 | 0.8 | ||
| 2002 | 0.7 | 0.8 | 1.2 | 0.4 | 0.9 | 0.5 | 0.6 | 0.5 | 1.0 | 0.9 | 1.0 | 1.5 | 1.0 | 0.8 | 0.5 | 1.0 | 0.8 | ||
| 2001 | 1.5 | 0.6 | 0.7 | 0.5 | 0.7 | 0.7 | 0.7 | 1.1 | 0.9 | 0.8 | 1.2 | 1.0 | 1.1 | 0.6 | 0.8 | 0.9 | 0.8 | ||
| 2000 | 0.7 | 0.9 | 0.8 | 0.6 | 0.7 | 0.5 | 0.8 | 0.7 | 1.0 | 1.1 | 1.3 | 1.1 | 0.9 | 0.7 | 0.7 | 1.1 | 0.8 | ||
| 1999 | 0.3 | 1.0 | 0.9 | 0.5 | 0.5 | 0.6 | 0.8 | 0.9 | 0.5 | 0.6 | 1.1 | 0.9 | 0.9 | 0.7 | 0.8 | 0.7 | 0.8 | ||
| 1998 | 0.1 | 0.5 | 0.6 | 0.2 | 0.3 | 0.5 | 0.3 | 0.0 | 0.5 | 0.4 | 0.1 | 0.6 | 0.4 | 0.4 | 0.3 | 0.4 | 0.4 | ||
| 1997 | 1.0 | 1.0 | 0.4 | 0.5 | 0.6 | 0.2 | 0.2 | 0.8 | 0.8 | 0.5 | 0.1 | 0.7 | 0.9 | 0.5 | 0.4 | 0.5 | 0.6 | ||
| 1996 | 0.3 | 0.4 | 1.2 | 0.1 | 0.9 | 1.1 | 0.0 | 0.3 | 0.7 | 0.1 | 0.7 | 1.7 | 0.8 | 0.7 | 0.5 | 0.5 | 0.6 | ||
| 1995 | 0.4 | 0.9 | 0.6 | 0.5 | 0.3 | 0.3 | 0.5 | 0.5 | 0.7 | 0.6 | 0.8 | 2.0 | 1.1 | 0.5 | 0.5 | 0.7 | 0.7 | ||
| 1994 | 0.7 | 1.0 | 0.5 | 0.7 | 0.4 | 2.3 | 0.5 | 0.3 | 0.6 | 0.7 | 0.8 | 0.1 | 0.5 | 0.5 | 0.9 | 0.7 | 0.6 | ||
| 1993 | 0.6 | 1.7 | 0.6 | 0.9 | 0.9 | 1.3 | 0.6 | 0.3 | 0.4 | 5.2 | 1.2 | 0.9 | 1.1 | 0.8 | 0.8 | 2.0 | 1.2 | ||
| 1992 | 1.6 | 0.5 | 0.9 | 1.1 | 1.1 | 0.7 | 0.3 | 0.7 | 0.8 | 1.8 | 1.5 | 0.2 | 0.8 | 1.0 | 0.5 | 1.3 | 1.0 | ||
| 1991 | 0.8 | 0.8 | 1.0 | 0.6 | 0.8 | 0.6 | 1.1 | 1.0 | 2.3 | 2.2 | 1.4 | 1.6 | 1.0 | 0.8 | 0.9 | 1.9 | 1.1 | ||
| 1990 | 0.2 | 0.3 | 0.2 | 0.1 | 0.2 | 0.2 | 0.4 | 0.3 | 1.1 | 2.2 | 2.0 | 1.0 | 0.4 | 0.2 | 0.3 | 1.7 | 0.6 | ||
| 1989 | 0.3 | 0.3 | 0.3 | 0.3 | 0.2 | 0.2 | 0.3 | 0.2 | 0.3 | 0.2 | 0.3 | 0.2 | 0.3 | 0.3 | 0.2 | 0.3 | 0.3 | ||
| 1988 | 0.2 | 0.2 | 0.2 | 0.2 | 0.2 | 0.2 | 0.2 | 0.2 | 0.2 | 0.3 | 0.2 | 0.3 | 0.2 | 0.2 | 0.2 | 0.2 | 0.2 | ||
| 1987 | 0.3 | 0.3 | 0.2 | 0.1 | 0.2 | 0.1 | 0.1 | 0.1 | 0.2 | 0.2 | 0.2 | 0.2 | 0.2 | 0.2 | 0.1 | 0.2 | 0.2 | ||
| 1986 | 0.8 | 0.1 | 0.4 | 0.6 | 0.4 | 0.0 | 0.3 | 0.5 | 0.5 | 0.8 | 0.3 | 0.1 | 0.3 | 0.5 | 0.3 | 0.6 | 0.4 | ||
| 1985 | 0.2 | 0.1 | 0.0 | 0.0 | 0.1 | 0.2 | 0.1 | 0.1 | 0.5 | 0.1 | 0.3 | 0.1 | 0.1 | 0.1 | 0.2 | 0.2 | 0.1 | ||
| 1984 | 0.0 | 0.0 | 0.0 | 0.0 | 0.0 | 0.0 | 0.1 | 0.0 | 0.0 | 0.0 | 0.1 | 0.0 | 0.0 | 0.0 | 0.1 | 0.0 | 0.0 | ||
| 1983 | 0.0 | 0.0 | 0.0 | 0.0 | 0.0 | 0.0 | 0.0 | 0.0 | 0.0 | - | 0.0 | 0.0 | 0.0 | 0.0 | 0.0 | 0.0 | 0.0 | ||
| 1982 | - | 0.0 | - | 0.0 | 0.0 | 0.0 | - | 0.0 | - | 0.0 | - | 0.0 | 0.0 | 0.0 | 0.0 | 0.0 | 0.0 | ||
Reporting rates
Reporting rate is the proportion of all surveys in which the species was present.
Reporting rate by year
This chart shows the reporting rate of Buff-rumped Thornbill each year between 1982 and 2017. 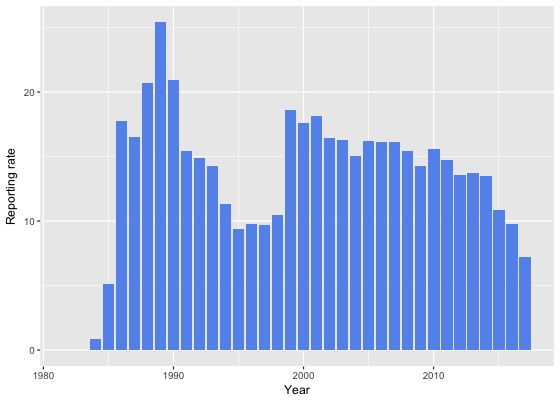
Reporting rate by month
This chart shows the reporting rate by month of Buff-rumped Thornbill. The blue lines show the reporting rate for the twelve months to June 2017 and the bars show the average reporting rate for the period 1982 to 2017. 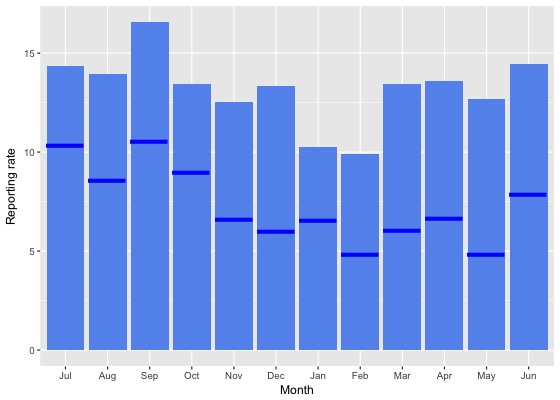
Reporting rate by season
This chart shows the seasonal reporting rate of Buff-rumped Thornbill. The blue lines show the seasonal reporting rate for the twelve months to June 2017 and the bars show the average seasonal reporting rate for the period 1982 to 2017. 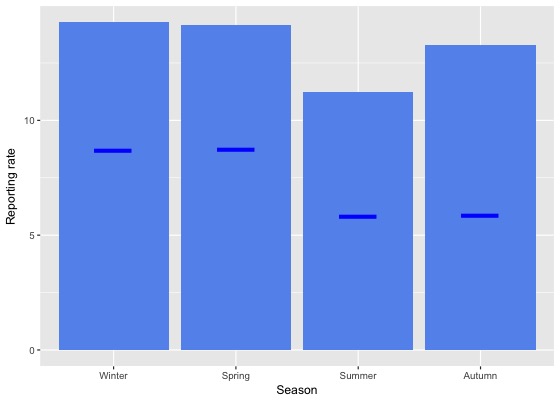
Reporting rate data
| Month | Season | ||||||||||||||||||
|---|---|---|---|---|---|---|---|---|---|---|---|---|---|---|---|---|---|---|---|
| Period | Jul | Aug | Sep | Oct | Nov | Dec | Jan | Feb | Mar | Apr | May | Jun | Winter | Spring | Summer | Autumn | All | ||
| All years | |||||||||||||||||||
| All | 14.4 | 13.9 | 16.5 | 13.4 | 12.6 | 13.3 | 10.3 | 9.9 | 13.4 | 13.6 | 12.7 | 14.4 | 14.3 | 14.2 | 11.2 | 13.3 | 13.2 | ||
| Previous years | |||||||||||||||||||
| All previous years | 15.0 | 15.0 | 17.4 | 14.0 | 13.5 | 14.5 | 11.0 | 11.0 | 14.7 | 14.7 | 14.5 | 15.7 | 15.3 | 14.9 | 12.2 | 14.7 | 14.2 | ||
| Previous 30 years | 15.0 | 15.2 | 17.5 | 14.1 | 13.6 | 14.7 | 11.0 | 11.1 | 14.8 | 14.8 | 14.6 | 15.9 | 15.4 | 15.0 | 12.3 | 14.7 | 14.3 | ||
| Previous 20 years | 14.3 | 13.9 | 17.5 | 13.8 | 12.5 | 14.3 | 10.1 | 10.3 | 14.0 | 14.1 | 13.4 | 15.6 | 14.7 | 14.6 | 11.6 | 13.9 | 13.7 | ||
| 10 year groups | |||||||||||||||||||
| [2007,2017) | 14.0 | 12.9 | 15.6 | 14.2 | 10.8 | 13.2 | 9.0 | 8.8 | 12.8 | 13.2 | 11.8 | 14.3 | 13.8 | 13.8 | 10.3 | 12.7 | 12.6 | ||
| [1997,2007) | 14.8 | 16.1 | 21.4 | 12.4 | 15.8 | 16.2 | 13.7 | 14.2 | 16.4 | 16.6 | 17.2 | 18.2 | 16.6 | 16.7 | 14.9 | 16.6 | 16.2 | ||
| [1987,1997) | 17.5 | 18.9 | 17.3 | 15.9 | 17.1 | 16.9 | 16.3 | 14.7 | 19.1 | 17.9 | 19.2 | 17.8 | 18.1 | 16.8 | 16.0 | 18.7 | 17.4 | ||
| 5 year groups | |||||||||||||||||||
| [2012,2017) | 13.9 | 12.3 | 13.8 | 13.9 | 9.3 | 11.9 | 8.7 | 8.1 | 12.1 | 12.5 | 10.5 | 12.5 | 12.8 | 12.7 | 9.5 | 11.9 | 11.6 | ||
| [2007,2012) | 14.1 | 15.1 | 19.6 | 14.9 | 15.2 | 16.1 | 10.2 | 11.6 | 14.8 | 14.8 | 15.4 | 17.6 | 16.2 | 16.3 | 13.1 | 14.9 | 15.2 | ||
| [2002,2007) | 15.0 | 15.7 | 22.2 | 12.9 | 16.1 | 15.8 | 12.0 | 11.5 | 16.1 | 18.3 | 16.3 | 17.6 | 16.3 | 17.1 | 13.6 | 16.9 | 16.0 | ||
| [1997,2002) | 14.5 | 16.5 | 20.5 | 11.6 | 15.5 | 16.7 | 15.6 | 17.0 | 16.8 | 14.5 | 18.3 | 18.9 | 17.0 | 16.2 | 16.5 | 16.3 | 16.4 | ||
| [1992,1997) | 10.5 | 10.9 | 11.5 | 11.3 | 16.7 | 15.8 | 6.4 | 6.8 | 11.4 | 11.9 | 12.5 | 10.8 | 10.7 | 13.2 | 9.7 | 11.9 | 11.5 | ||
| [1987,1992) | 20.7 | 23.3 | 20.0 | 18.5 | 17.3 | 17.4 | 21.7 | 17.7 | 23.7 | 21.4 | 22.7 | 21.7 | 21.9 | 18.5 | 18.9 | 22.6 | 20.4 | ||
| Year | |||||||||||||||||||
| 2017 | 10.4 | 8.6 | 10.5 | 9.0 | 6.6 | 6.0 | 6.6 | 4.8 | 6.0 | 6.7 | 4.8 | 7.9 | 8.7 | 8.7 | 5.8 | 5.9 | 7.2 | ||
| 2016 | 14.4 | 10.3 | 11.2 | 11.4 | 9.0 | 9.3 | 6.9 | 6.3 | 10.6 | 11.3 | 7.8 | 10.2 | 11.5 | 10.7 | 7.3 | 10.1 | 9.8 | ||
| 2015 | 13.1 | 10.7 | 13.4 | 14.8 | 9.0 | 11.2 | 9.7 | 7.4 | 9.5 | 10.4 | 9.9 | 11.0 | 11.5 | 12.7 | 9.5 | 9.9 | 10.9 | ||
| 2014 | 16.4 | 16.0 | 17.7 | 16.3 | 7.8 | 15.9 | 9.4 | 10.4 | 14.7 | 14.8 | 13.6 | 12.0 | 14.1 | 14.9 | 11.0 | 14.5 | 13.5 | ||
| 2013 | 12.7 | 18.6 | 16.6 | 17.1 | 11.5 | 11.7 | 9.3 | 10.6 | 14.3 | 14.9 | 14.2 | 14.8 | 15.3 | 15.5 | 10.6 | 14.5 | 13.7 | ||
| 2012 | 13.4 | 13.0 | 14.2 | 12.1 | 9.0 | 16.7 | 9.2 | 12.2 | 16.7 | 15.4 | 15.5 | 19.6 | 15.7 | 11.9 | 12.2 | 15.9 | 13.5 | ||
| 2011 | 14.6 | 16.8 | 19.8 | 19.6 | 15.8 | 11.6 | 12.4 | 10.5 | 11.9 | 16.6 | 11.3 | 14.5 | 15.0 | 19.0 | 11.6 | 13.3 | 14.7 | ||
| 2010 | 18.8 | 16.7 | 21.3 | 15.8 | 13.9 | 14.2 | 7.7 | 12.9 | 15.4 | 12.3 | 15.7 | 21.0 | 19.5 | 16.9 | 11.6 | 14.2 | 15.6 | ||
| 2009 | 12.2 | 11.5 | 13.9 | 12.5 | 14.3 | 15.3 | 9.3 | 10.0 | 16.7 | 17.2 | 14.5 | 20.3 | 16.0 | 13.3 | 12.0 | 16.4 | 14.3 | ||
| 2008 | 15.2 | 14.8 | 22.8 | 11.3 | 16.1 | 14.4 | 15.9 | 10.2 | 18.3 | 13.0 | 20.7 | 19.2 | 16.9 | 15.1 | 13.8 | 16.0 | 15.4 | ||
| 2007 | 9.9 | 14.8 | 20.3 | 16.3 | 16.9 | 24.5 | 7.1 | 15.7 | 13.6 | 15.0 | 20.3 | 15.3 | 14.2 | 17.6 | 16.3 | 15.5 | 16.1 | ||
| 2006 | 20.4 | 18.4 | 20.7 | 16.4 | 19.6 | 15.6 | 10.1 | 14.8 | 12.9 | 18.8 | 11.6 | 16.1 | 17.8 | 18.3 | 13.4 | 14.3 | 16.1 | ||
| 2005 | 8.1 | 9.3 | 21.6 | 8.8 | 12.4 | 16.3 | 17.0 | 13.0 | 14.7 | 20.2 | 18.9 | 21.8 | 15.4 | 15.5 | 15.9 | 17.7 | 16.2 | ||
| 2004 | 9.5 | 17.1 | 21.6 | 12.2 | 18.0 | 15.2 | 8.5 | 9.1 | 17.1 | 20.3 | 13.6 | 15.3 | 13.2 | 17.6 | 11.6 | 17.6 | 15.0 | ||
| 2003 | 25.6 | 18.7 | 20.8 | 13.0 | 13.3 | 17.4 | 11.9 | 9.3 | 20.6 | 15.7 | 18.6 | 11.8 | 18.0 | 15.9 | 13.4 | 18.3 | 16.3 | ||
| 2002 | 16.6 | 13.6 | 26.9 | 10.7 | 17.0 | 14.7 | 13.2 | 11.8 | 17.3 | 16.7 | 17.6 | 21.0 | 17.5 | 17.8 | 13.7 | 17.1 | 16.4 | ||
| 2001 | 21.3 | 16.3 | 22.3 | 10.1 | 18.2 | 20.3 | 19.5 | 20.1 | 17.2 | 12.7 | 19.1 | 18.7 | 19.0 | 17.4 | 20.0 | 16.3 | 18.1 | ||
| 2000 | 11.1 | 22.9 | 24.2 | 13.2 | 13.9 | 14.4 | 16.1 | 17.6 | 21.2 | 19.9 | 22.7 | 16.7 | 17.2 | 17.0 | 15.8 | 21.0 | 17.6 | ||
| 1999 | 11.8 | 15.5 | 23.0 | 14.5 | 19.5 | 18.1 | 14.6 | 19.3 | 16.2 | 14.9 | 20.5 | 26.6 | 22.0 | 19.1 | 17.4 | 17.1 | 18.6 | ||
| 1998 | 5.4 | 7.5 | 17.1 | 7.6 | 9.7 | 17.0 | 11.8 | 3.8 | 7.5 | 5.1 | 7.4 | 10.7 | 8.5 | 11.9 | 12.3 | 6.9 | 10.5 | ||
| 1997 | 6.9 | 10.3 | 8.2 | 10.5 | 14.5 | 11.5 | 5.9 | 10.5 | 10.0 | 9.2 | 2.2 | 11.1 | 9.2 | 11.2 | 9.9 | 7.7 | 9.7 | ||
| 1996 | 7.5 | 9.6 | 18.7 | 5.3 | 19.4 | 19.2 | 1.0 | 3.5 | 9.8 | 1.6 | 3.4 | 13.8 | 10.5 | 13.8 | 8.0 | 5.8 | 9.8 | ||
| 1995 | 8.6 | 5.4 | 4.9 | 7.9 | 10.0 | 6.9 | 8.8 | 9.5 | 12.2 | 8.9 | 14.3 | 19.1 | 10.4 | 7.7 | 8.4 | 11.4 | 9.4 | ||
| 1994 | 13.7 | 15.6 | 13.2 | 16.3 | 11.0 | 23.9 | 8.8 | 5.2 | 12.5 | 10.7 | 8.8 | 2.2 | 9.7 | 13.1 | 11.6 | 10.7 | 11.3 | ||
| 1993 | 8.2 | 17.9 | 12.9 | 14.7 | 21.2 | 26.1 | 10.2 | 3.1 | 7.4 | 18.3 | 14.3 | 13.0 | 13.8 | 16.3 | 14.2 | 12.8 | 14.2 | ||
| 1992 | 15.4 | 9.3 | 10.6 | 17.0 | 29.2 | 9.5 | 5.2 | 14.6 | 15.5 | 25.4 | 19.7 | 3.3 | 9.5 | 18.3 | 9.3 | 19.9 | 14.9 | ||
| 1991 | 15.0 | 9.6 | 12.8 | 15.5 | 15.5 | 5.4 | 16.1 | 16.0 | 23.8 | 22.0 | 19.7 | 22.0 | 14.4 | 14.7 | 11.7 | 21.9 | 15.4 | ||
| 1990 | 21.9 | 29.2 | 17.2 | 13.3 | 16.8 | 18.1 | 27.8 | 16.9 | 19.3 | 16.7 | 30.1 | 17.1 | 24.3 | 15.8 | 20.9 | 21.6 | 21.0 | ||
| 1989 | 26.5 | 26.7 | 25.8 | 28.5 | 21.7 | 20.4 | 29.3 | 22.7 | 26.7 | 22.1 | 32.9 | 22.6 | 25.5 | 25.6 | 23.9 | 26.8 | 25.4 | ||
| 1988 | 18.5 | 22.0 | 19.7 | 16.8 | 16.6 | 21.5 | 20.6 | 17.7 | 24.8 | 27.3 | 20.2 | 25.1 | 21.8 | 17.4 | 20.0 | 24.0 | 20.7 | ||
| 1987 | 9.1 | 6.7 | 18.6 | 13.3 | 16.1 | 14.2 | 14.9 | 14.2 | 22.0 | 17.7 | 16.6 | 19.1 | 17.8 | 16.0 | 14.4 | 18.6 | 16.5 | ||
| 1986 | 23.1 | 10.5 | 22.6 | 27.8 | 19.1 | 2.9 | 17.4 | 16.7 | 19.4 | 23.5 | 13.8 | 11.4 | 14.1 | 22.8 | 11.8 | 19.8 | 17.8 | ||
| 1985 | 10.0 | 6.7 | 1.9 | 1.2 | 7.0 | 5.0 | 12.5 | 5.9 | 18.2 | 5.3 | 10.0 | 3.6 | 6.8 | 3.1 | 5.9 | 10.0 | 5.1 | ||
| 1984 | 0.0 | 0.0 | 0.0 | 0.0 | 0.0 | 0.0 | 3.4 | 0.0 | 0.0 | 0.0 | 3.2 | 0.0 | 0.0 | 0.0 | 1.4 | 1.1 | 0.8 | ||
| 1983 | 0.0 | 0.0 | 0.0 | 0.0 | 0.0 | 0.0 | 0.0 | 0.0 | 0.0 | - | 0.0 | 0.0 | 0.0 | 0.0 | 0.0 | 0.0 | 0.0 | ||
| 1982 | - | 0.0 | - | 0.0 | 0.0 | 0.0 | - | 0.0 | - | 0.0 | - | 0.0 | 0.0 | 0.0 | 0.0 | 0.0 | 0.0 | ||
Breeding data
Breeding records by month
Number of breeding records by breeding code and month, 2017 and all years| Breeding code | Jul | Aug | Sep | Oct | Nov | Dec | Jan | Feb | Mar | Apr | May | Jun |
|---|---|---|---|---|---|---|---|---|---|---|---|---|
| 2017 | ||||||||||||
| Breeding (BLA code) | 0 | 0 | 0 | 0 | 0 | 0 | 0 | 0 | 0 | 0 | 0 | 0 |
| Carrying Food | 0 | 0 | 0 | 1 | 3 | 0 | 1 | 0 | 0 | 0 | 0 | 0 |
| Copulating | 0 | 0 | 0 | 0 | 0 | 0 | 0 | 0 | 0 | 0 | 0 | 0 |
| Display | 0 | 1 | 0 | 1 | 0 | 0 | 0 | 0 | 0 | 0 | 0 | 0 |
| Dependent young | 0 | 0 | 1 | 6 | 4 | 2 | 3 | 4 | 0 | 1 | 0 | 0 |
| Faecal sac | 0 | 0 | 0 | 0 | 0 | 0 | 0 | 0 | 0 | 0 | 0 | 0 |
| Inspecting hollow | 0 | 0 | 0 | 0 | 0 | 0 | 0 | 0 | 0 | 0 | 0 | 1 |
| Nest building | 1 | 4 | 0 | 1 | 0 | 1 | 1 | 0 | 0 | 0 | 0 | 0 |
| Nest with eggs | 0 | 0 | 0 | 0 | 1 | 0 | 0 | 0 | 0 | 0 | 0 | 0 |
| Nest with young | 0 | 0 | 1 | 3 | 3 | 0 | 1 | 0 | 0 | 0 | 0 | 0 |
| On/leaving nest | 0 | 0 | 0 | 1 | 0 | 1 | 0 | 0 | 0 | 0 | 0 | 0 |
| All years | ||||||||||||
| Breeding (BLA code) | 0 | 1 | 5 | 3 | 0 | 1 | 1 | 0 | 0 | 1 | 0 | 0 |
| Carrying Food | 0 | 0 | 2 | 17 | 6 | 4 | 2 | 0 | 0 | 0 | 0 | 0 |
| Copulating | 0 | 0 | 0 | 0 | 0 | 0 | 0 | 0 | 0 | 0 | 0 | 0 |
| Display | 0 | 1 | 1 | 1 | 0 | 0 | 0 | 0 | 0 | 0 | 0 | 0 |
| Dependent young | 0 | 3 | 11 | 70 | 48 | 55 | 29 | 20 | 5 | 1 | 0 | 0 |
| Faecal sac | 0 | 0 | 0 | 1 | 0 | 0 | 0 | 0 | 0 | 0 | 0 | 0 |
| Inspecting hollow | 0 | 0 | 2 | 1 | 0 | 0 | 0 | 1 | 0 | 0 | 0 | 1 |
| Nest building | 9 | 22 | 15 | 18 | 10 | 5 | 6 | 0 | 0 | 0 | 0 | 3 |
| Nest with eggs | 0 | 1 | 2 | 6 | 2 | 1 | 0 | 0 | 0 | 0 | 0 | 0 |
| Nest with young | 0 | 5 | 7 | 16 | 8 | 4 | 2 | 0 | 0 | 0 | 0 | 0 |
| On/leaving nest | 0 | 3 | 2 | 13 | 5 | 2 | 0 | 0 | 0 | 0 | 0 | 0 |
Breeding records by year
Average number of breeding records per period by breeding code| Period | Breeding (BLA code) | Carrying Food | Copulating | Display | Dependent young | Faecal sac | Inspecting hollow | Nest building | Nest with eggs | Nest with young | On/leaving nest |
|---|---|---|---|---|---|---|---|---|---|---|---|
| All years | |||||||||||
| All | 0.3 | 0.9 | 0.0 | 0.1 | 6.7 | 0.0 | 0.1 | 2.4 | 0.3 | 1.2 | 0.7 |
| Previous years | |||||||||||
| All previous years | 0.3 | 0.7 | 0.0 | 0.0 | 6.3 | 0.0 | 0.1 | 2.3 | 0.3 | 1.0 | 0.7 |
| Previous 30 years | 0.4 | 0.9 | 0.0 | 0.0 | 7.3 | 0.0 | 0.1 | 2.7 | 0.4 | 1.1 | 0.8 |
| Previous 20 years | 0.6 | 1.1 | 0.0 | 0.0 | 7.2 | 0.0 | 0.2 | 2.9 | 0.2 | 1.2 | 1.1 |
| 10 year groups | |||||||||||
| [2007,2017) | 1.0 | 1.6 | 0.0 | 0.1 | 11.2 | 0.1 | 0.3 | 4.1 | 0.4 | 2.0 | 1.9 |
| [1997,2007) | 0.2 | 0.5 | 0.0 | 0.0 | 3.1 | 0.0 | 0.1 | 1.6 | 0.0 | 0.5 | 0.4 |
| [1987,1997) | 0.0 | 0.5 | 0.0 | 0.0 | 7.7 | 0.0 | 0.0 | 2.3 | 0.7 | 0.9 | 0.0 |
| 5 year groups | |||||||||||
| [2012,2017) | 0.6 | 1.2 | 0.0 | 0.2 | 12.4 | 0.2 | 0.6 | 5.6 | 0.6 | 3.0 | 2.4 |
| [2007,2012) | 1.4 | 2.0 | 0.0 | 0.0 | 10.0 | 0.0 | 0.0 | 2.6 | 0.2 | 1.0 | 1.4 |
| [2002,2007) | 0.0 | 1.0 | 0.0 | 0.0 | 3.6 | 0.0 | 0.2 | 1.2 | 0.0 | 0.8 | 0.8 |
| [1997,2002) | 0.4 | 0.0 | 0.0 | 0.0 | 2.6 | 0.0 | 0.0 | 2.0 | 0.0 | 0.2 | 0.0 |
| [1992,1997) | 0.0 | 0.4 | 0.0 | 0.0 | 1.2 | 0.0 | 0.0 | 0.4 | 0.0 | 0.0 | 0.0 |
| [1987,1992) | 0.0 | 0.6 | 0.0 | 0.0 | 14.2 | 0.0 | 0.0 | 4.2 | 1.4 | 1.8 | 0.0 |
| Year | |||||||||||
| 2017 | 0.0 | 5.0 | 0.0 | 2.0 | 21.0 | 0.0 | 1.0 | 8.0 | 1.0 | 8.0 | 2.0 |
| 2016 | 0.0 | 2.0 | 0.0 | 1.0 | 13.0 | 0.0 | 1.0 | 7.0 | 0.0 | 5.0 | 9.0 |
| 2015 | 0.0 | 0.0 | 0.0 | 0.0 | 12.0 | 0.0 | 2.0 | 9.0 | 2.0 | 3.0 | 1.0 |
| 2014 | 0.0 | 0.0 | 0.0 | 0.0 | 16.0 | 0.0 | 0.0 | 5.0 | 1.0 | 5.0 | 0.0 |
| 2013 | 2.0 | 2.0 | 0.0 | 0.0 | 8.0 | 1.0 | 0.0 | 4.0 | 0.0 | 2.0 | 2.0 |
| 2012 | 1.0 | 2.0 | 0.0 | 0.0 | 13.0 | 0.0 | 0.0 | 3.0 | 0.0 | 0.0 | 0.0 |
| 2011 | 0.0 | 5.0 | 0.0 | 0.0 | 20.0 | 0.0 | 0.0 | 5.0 | 0.0 | 1.0 | 1.0 |
| 2010 | 0.0 | 3.0 | 0.0 | 0.0 | 10.0 | 0.0 | 0.0 | 2.0 | 0.0 | 1.0 | 3.0 |
| 2009 | 0.0 | 0.0 | 0.0 | 0.0 | 3.0 | 0.0 | 0.0 | 2.0 | 1.0 | 1.0 | 0.0 |
| 2008 | 1.0 | 0.0 | 0.0 | 0.0 | 6.0 | 0.0 | 0.0 | 3.0 | 0.0 | 2.0 | 2.0 |
| 2007 | 6.0 | 2.0 | 0.0 | 0.0 | 11.0 | 0.0 | 0.0 | 1.0 | 0.0 | 0.0 | 1.0 |
| 2006 | 0.0 | 2.0 | 0.0 | 0.0 | 5.0 | 0.0 | 1.0 | 1.0 | 0.0 | 3.0 | 1.0 |
| 2005 | 0.0 | 1.0 | 0.0 | 0.0 | 3.0 | 0.0 | 0.0 | 2.0 | 0.0 | 0.0 | 2.0 |
| 2004 | 0.0 | 2.0 | 0.0 | 0.0 | 2.0 | 0.0 | 0.0 | 2.0 | 0.0 | 0.0 | 0.0 |
| 2003 | 0.0 | 0.0 | 0.0 | 0.0 | 4.0 | 0.0 | 0.0 | 0.0 | 0.0 | 1.0 | 1.0 |
| 2002 | 0.0 | 0.0 | 0.0 | 0.0 | 4.0 | 0.0 | 0.0 | 1.0 | 0.0 | 0.0 | 0.0 |
| 2001 | 0.0 | 0.0 | 0.0 | 0.0 | 2.0 | 0.0 | 0.0 | 2.0 | 0.0 | 0.0 | 0.0 |
| 2000 | 2.0 | 0.0 | 0.0 | 0.0 | 6.0 | 0.0 | 0.0 | 6.0 | 0.0 | 0.0 | 0.0 |
| 1999 | 0.0 | 0.0 | 0.0 | 0.0 | 3.0 | 0.0 | 0.0 | 1.0 | 0.0 | 0.0 | 0.0 |
| 1998 | 0.0 | 0.0 | 0.0 | 0.0 | 1.0 | 0.0 | 0.0 | 1.0 | 0.0 | 1.0 | 0.0 |
| 1997 | 0.0 | 0.0 | 0.0 | 0.0 | 1.0 | 0.0 | 0.0 | 0.0 | 0.0 | 0.0 | 0.0 |
| 1996 | 0.0 | 1.0 | 0.0 | 0.0 | 0.0 | 0.0 | 0.0 | 0.0 | 0.0 | 0.0 | 0.0 |
| 1995 | 0.0 | 0.0 | 0.0 | 0.0 | 0.0 | 0.0 | 0.0 | 1.0 | 0.0 | 0.0 | 0.0 |
| 1994 | 0.0 | 0.0 | 0.0 | 0.0 | 0.0 | 0.0 | 0.0 | 0.0 | 0.0 | 0.0 | 0.0 |
| 1993 | 0.0 | 1.0 | 0.0 | 0.0 | 1.0 | 0.0 | 0.0 | 0.0 | 0.0 | 0.0 | 0.0 |
| 1992 | 0.0 | 0.0 | 0.0 | 0.0 | 5.0 | 0.0 | 0.0 | 1.0 | 0.0 | 0.0 | 0.0 |
| 1991 | 0.0 | 0.0 | 0.0 | 0.0 | 2.0 | 0.0 | 0.0 | 1.0 | 1.0 | 1.0 | 0.0 |
| 1990 | 0.0 | 0.0 | 0.0 | 0.0 | 7.0 | 0.0 | 0.0 | 2.0 | 0.0 | 4.0 | 0.0 |
| 1989 | 0.0 | 1.0 | 0.0 | 0.0 | 21.0 | 0.0 | 0.0 | 12.0 | 3.0 | 2.0 | 0.0 |
| 1988 | 0.0 | 2.0 | 0.0 | 0.0 | 21.0 | 0.0 | 0.0 | 3.0 | 0.0 | 0.0 | 0.0 |
| 1987 | 0.0 | 0.0 | 0.0 | 0.0 | 20.0 | 0.0 | 0.0 | 3.0 | 3.0 | 2.0 | 0.0 |
| 1986 | 0.0 | 0.0 | 0.0 | 0.0 | 1.0 | 0.0 | 0.0 | 0.0 | 0.0 | 0.0 | 0.0 |
| 1985 | 0.0 | 0.0 | 0.0 | 0.0 | 0.0 | 0.0 | 0.0 | 0.0 | 0.0 | 0.0 | 0.0 |
| 1984 | 0.0 | 0.0 | 0.0 | 0.0 | 0.0 | 0.0 | 0.0 | 0.0 | 0.0 | 0.0 | 0.0 |
| 1983 | 0.0 | 0.0 | 0.0 | 0.0 | 0.0 | 0.0 | 0.0 | 0.0 | 0.0 | 0.0 | 0.0 |
| 1982 | 0.0 | 0.0 | 0.0 | 0.0 | 0.0 | 0.0 | 0.0 | 0.0 | 0.0 | 0.0 | 0.0 |
Distribution map
Distribution - 2017
This map shows the observed distribution of the Buff-rumped Thornbill for 2017.
The red circles are the grid cells where Buff-rumped Thornbill have been reported.
The transparency of the red circles indicate how many surveys sheets were submitted for that grid cell; the darker the red the more reliable the data. Of the 315 grid cells with reports, 83 had only one sheet; an example is grid number A9.
The size of the circle represents the reporting rate. The maximum reporting rate for Buff-rumped Thornbill was 100.0% (eg grid number A9) and the minimum was 0.2% (eg grid number J14). 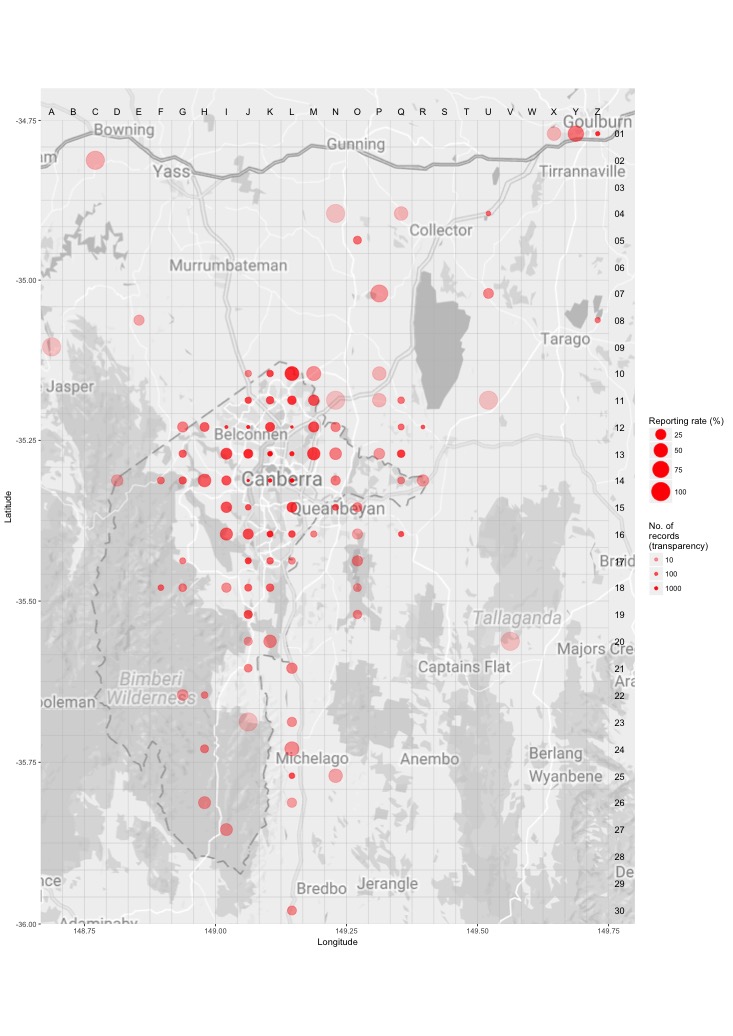
Distribution - all years
This map shows the observed distribution of the Buff-rumped Thornbill for all years.
The red circles are the grid cells where Buff-rumped Thornbill have been reported.
The transparency of the red circles indicate how many surveys sheets were submitted for that grid cell; the darker the red the more reliable the data. Of the 703 grid cells with reports, 55 had only one sheet; an example is grid number P30.
The size of the circle represents the reporting rate. The maximum reporting rate for Buff-rumped Thornbill was 100.0% (eg grid number I1) and the minimum was 0.3% (eg grid number I11). 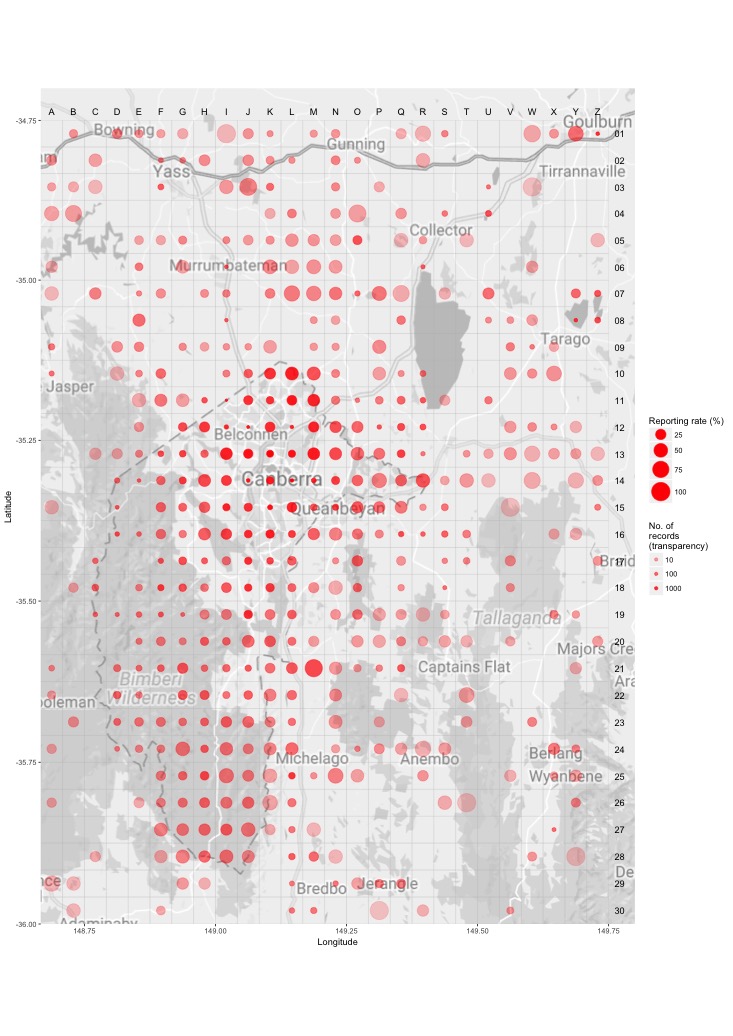
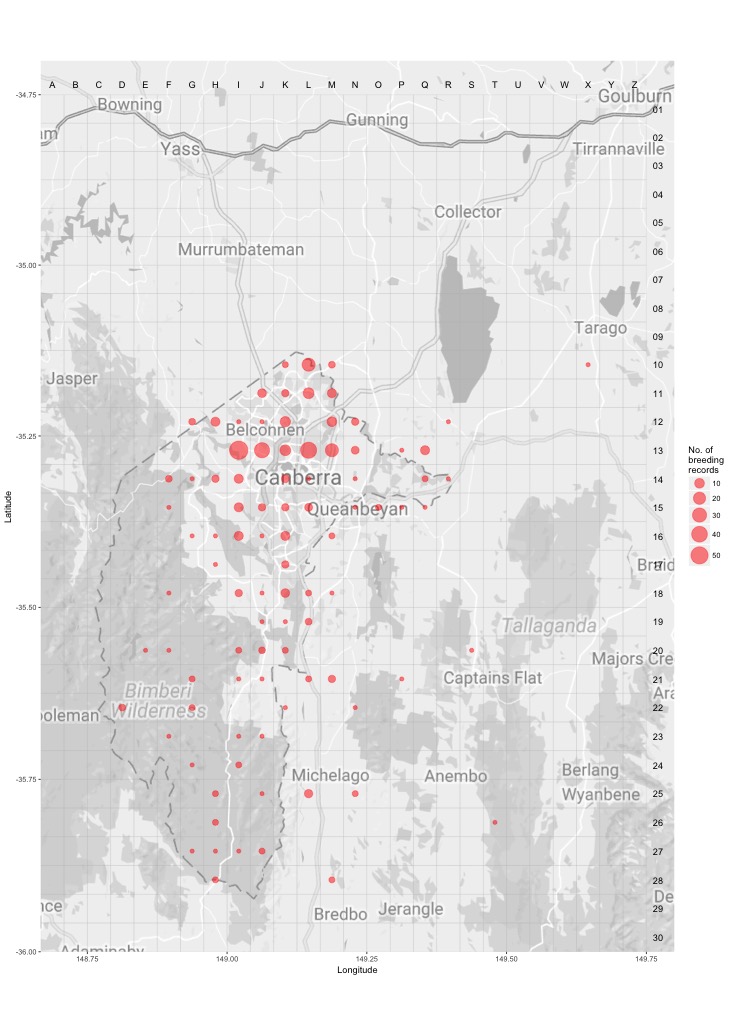
Breeding map
Breeding - 2017
This map shows the breeding distribution of the Buff-rumped Thornbill for 2017.
The red circles are the grid cells where breeding activity for Buff-rumped Thornbill have been reported.
The size of the circle represents the number of reports. 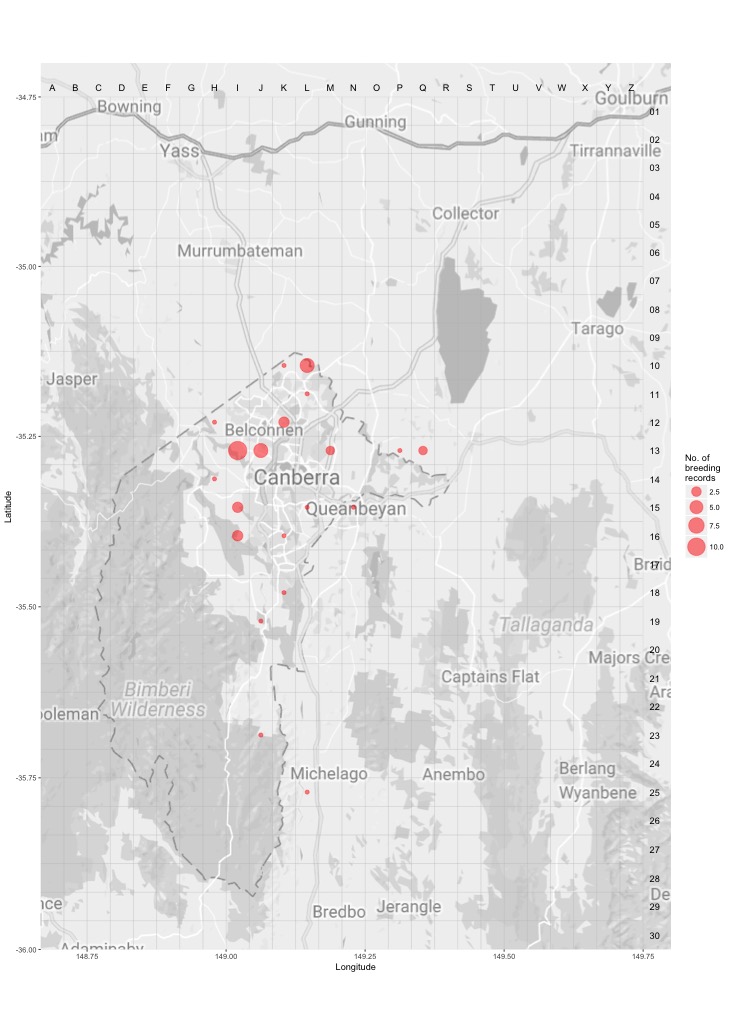
Breeding - all years
This map shows the breeding distribution of the Buff-rumped Thornbill for all years.
The red circles are the grid cells where breeding activity for Buff-rumped Thornbill have been reported.
The size of the circle represents the number of reports.